Startup Times
When a container group starts, its image is first pulled from your registry into SaladCloud’s internal caches in Europe and the US (only once), and then distributed to the allocated nodes. Startup times can range from a few minutes to longer, depending on image size and network conditions. Instances on nodes located closer to a cache or with higher throughput typically come online faster. You can further improve startup speed by using smaller images to reduce transfer and decompression time, and by deploying workloads in regions closer to the EU or US. Our 2025 test measured the startup times for 100 container instances at high-priority across all consumer GPU types and regions, using a 5.53 GB image. This metric tracks the number of instances that became operational since startup: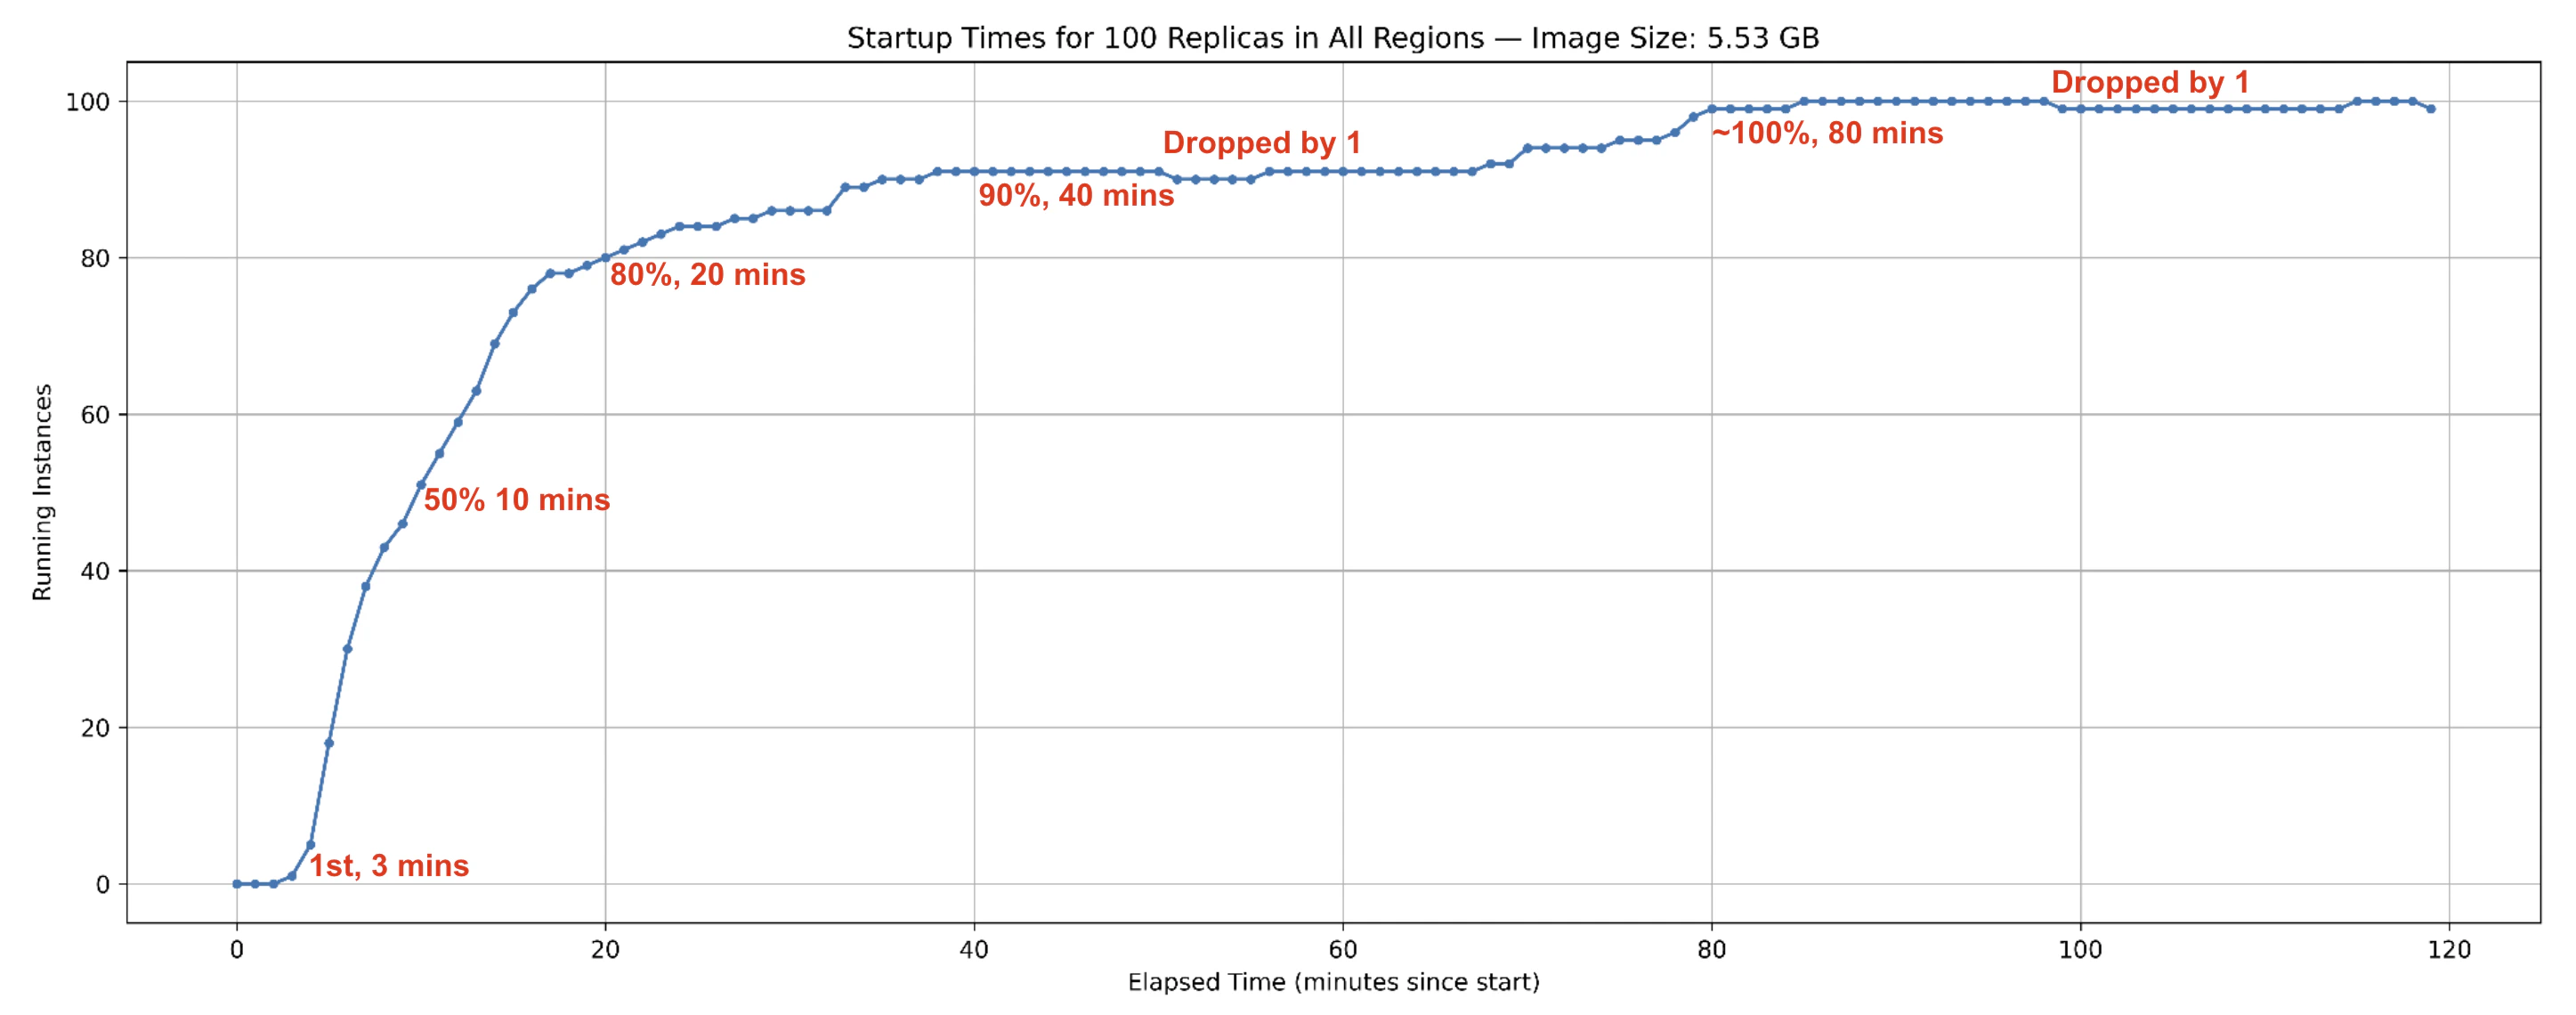
- Instances began coming online and reporting results within
3 minutesof the test start. 50% of instancescame online by10 minutes,80%by20 minutesand90%by40 minutes.- The count of online instances then briefly dropped by one, indicating one instance was just reallocated.
- By around
80 minutes, nearly all 100 instances were online, with minor fluctuations afterward due to reallocations.
Interruptions and Reallocations
An instance may go offline after coming online for several reasons. In such cases, a new instance is allocated to continue processing:- Voluntary Interruptions: Node owners may temporarily reclaim their resources for their own use, pausing sharing. However, high-priority workloads that run reliably over long periods generate higher earnings, giving owners less incentive to interrupt.
- External Interruptions: Factors such as power outages, network issues, or hardware failures can also take nodes offline.
- Proactive Reallocations: During periods of high demand, SaladCloud may reassign resources from lower-priority workloads to higher-priority ones. Applications can also trigger reallocation via IMDS Reallocate API if current instances fail to meet requirements.
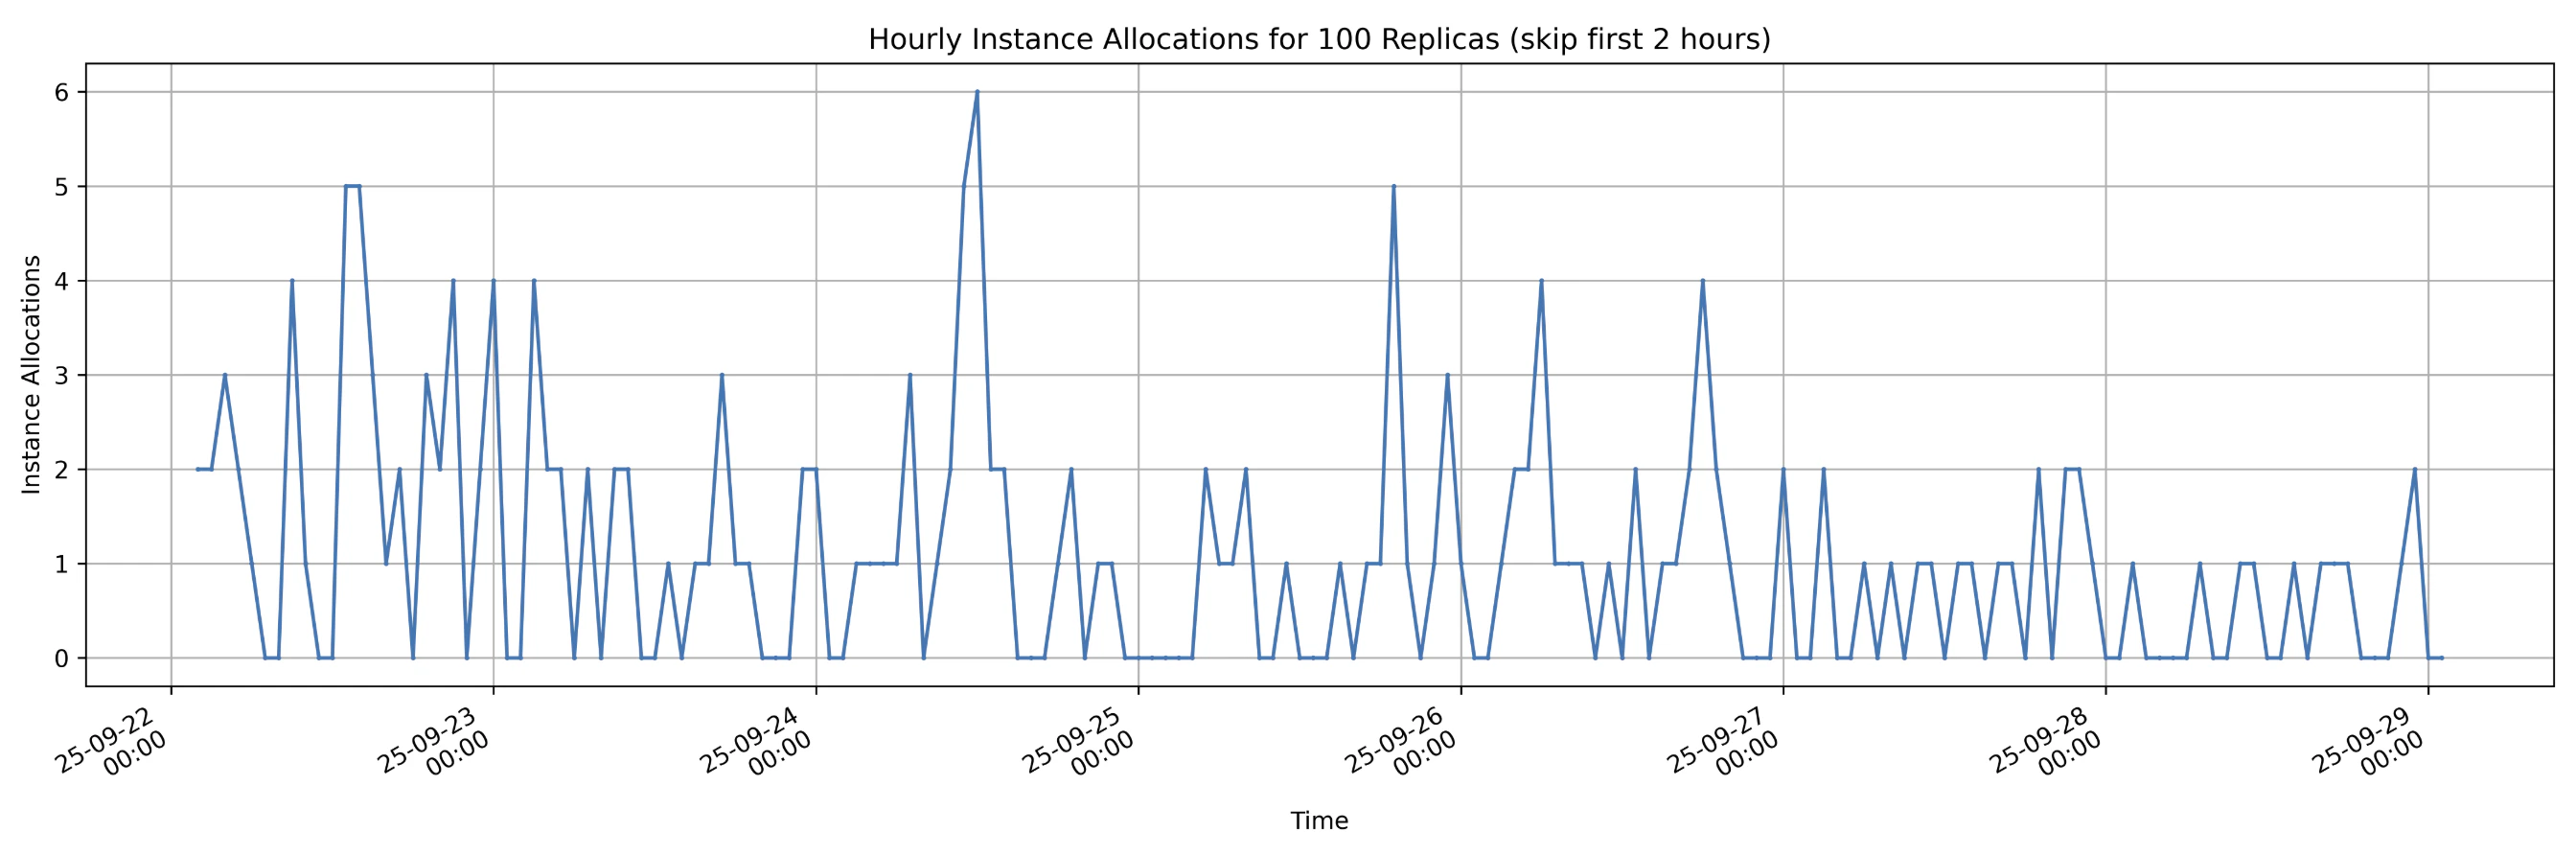
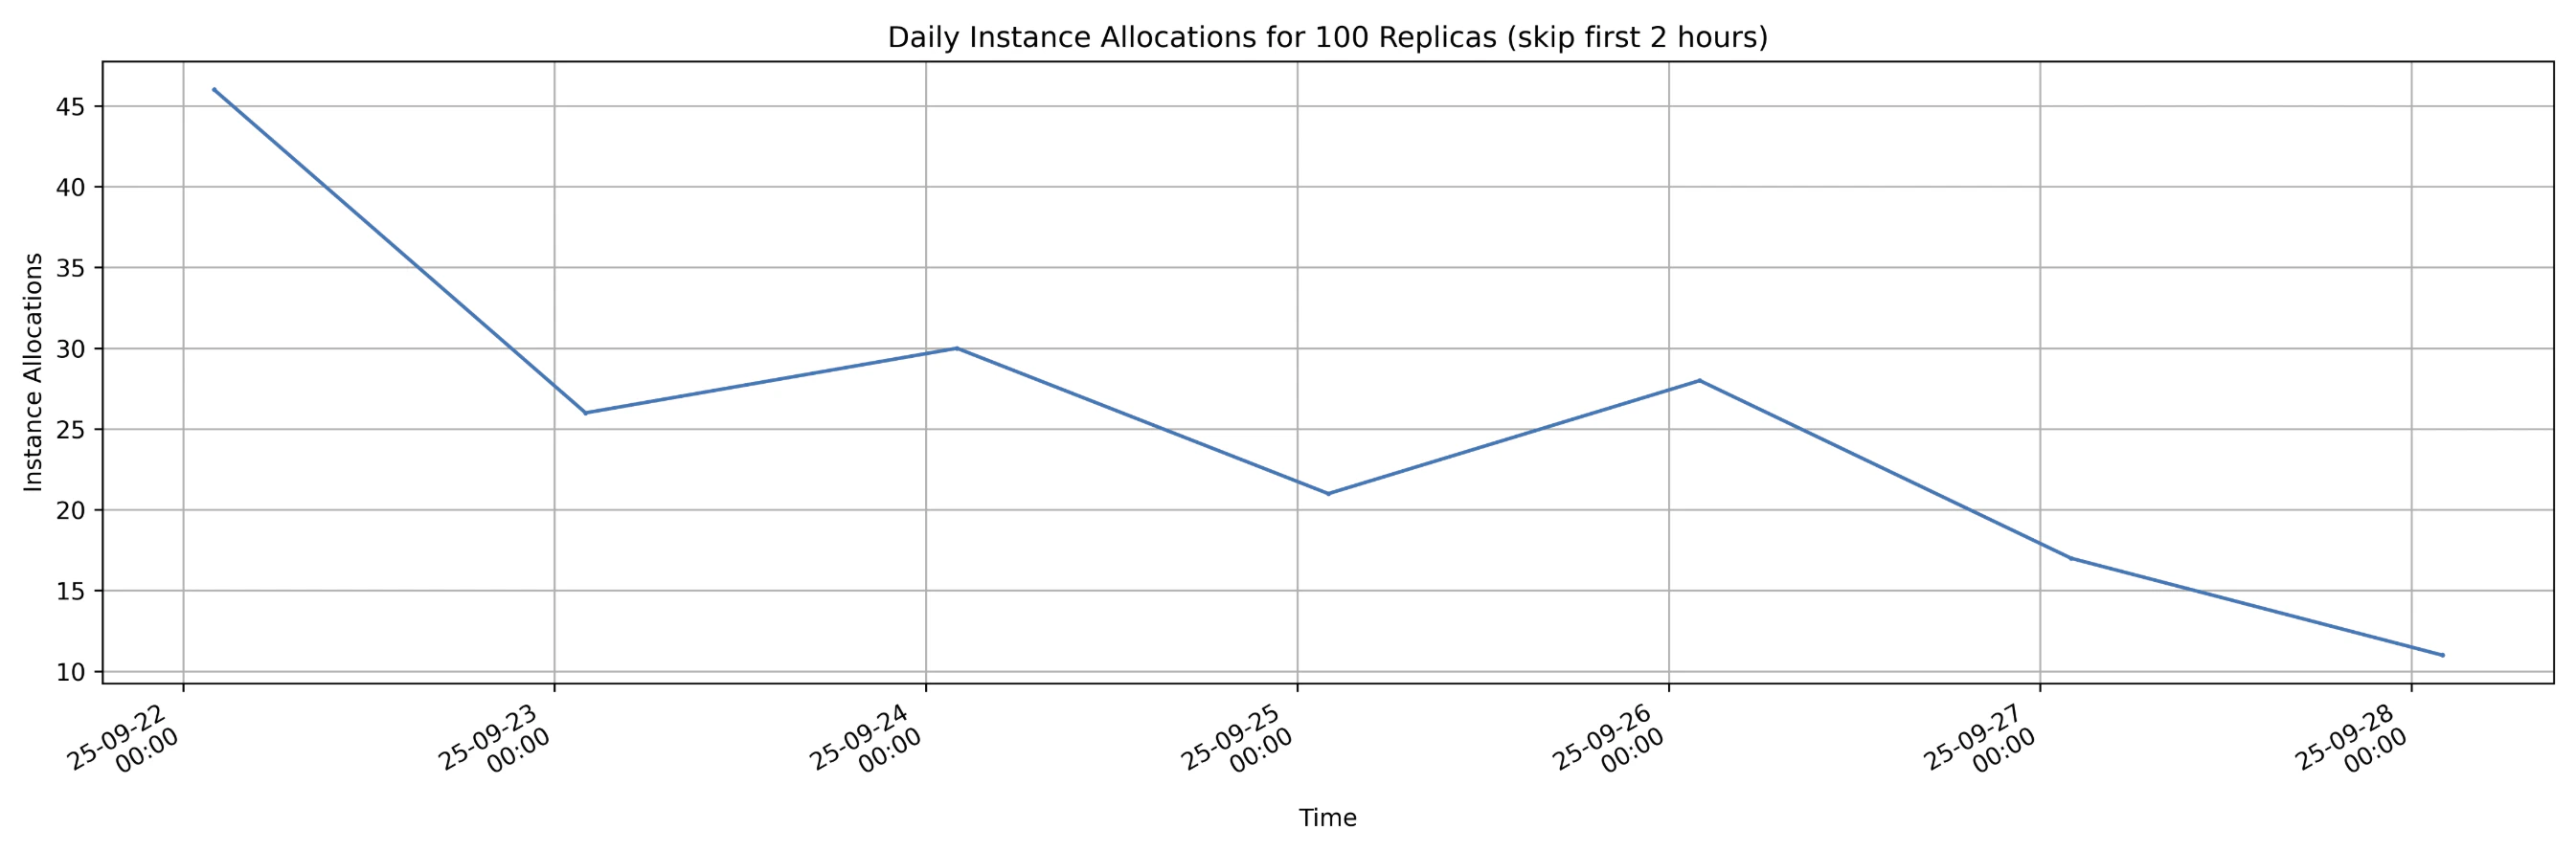
- Maximum hourly reallocations:
6 - Average hourly reallocations:
1.1 ( 182 reallocations over 168 hours ) - Reallocations decreased over time, dropping from more than
45 per dayto fewer than15 per day, with some fluctuations along the way. This trend shows that as applications run stably for longer periods on nodes, the likelihood of interruption by node owners decreases.
Uptimes
Additionally, the 2025 test measured the uptime distributions of instances over the same period, which are primarily influenced by startup times and interruptions. The results show that: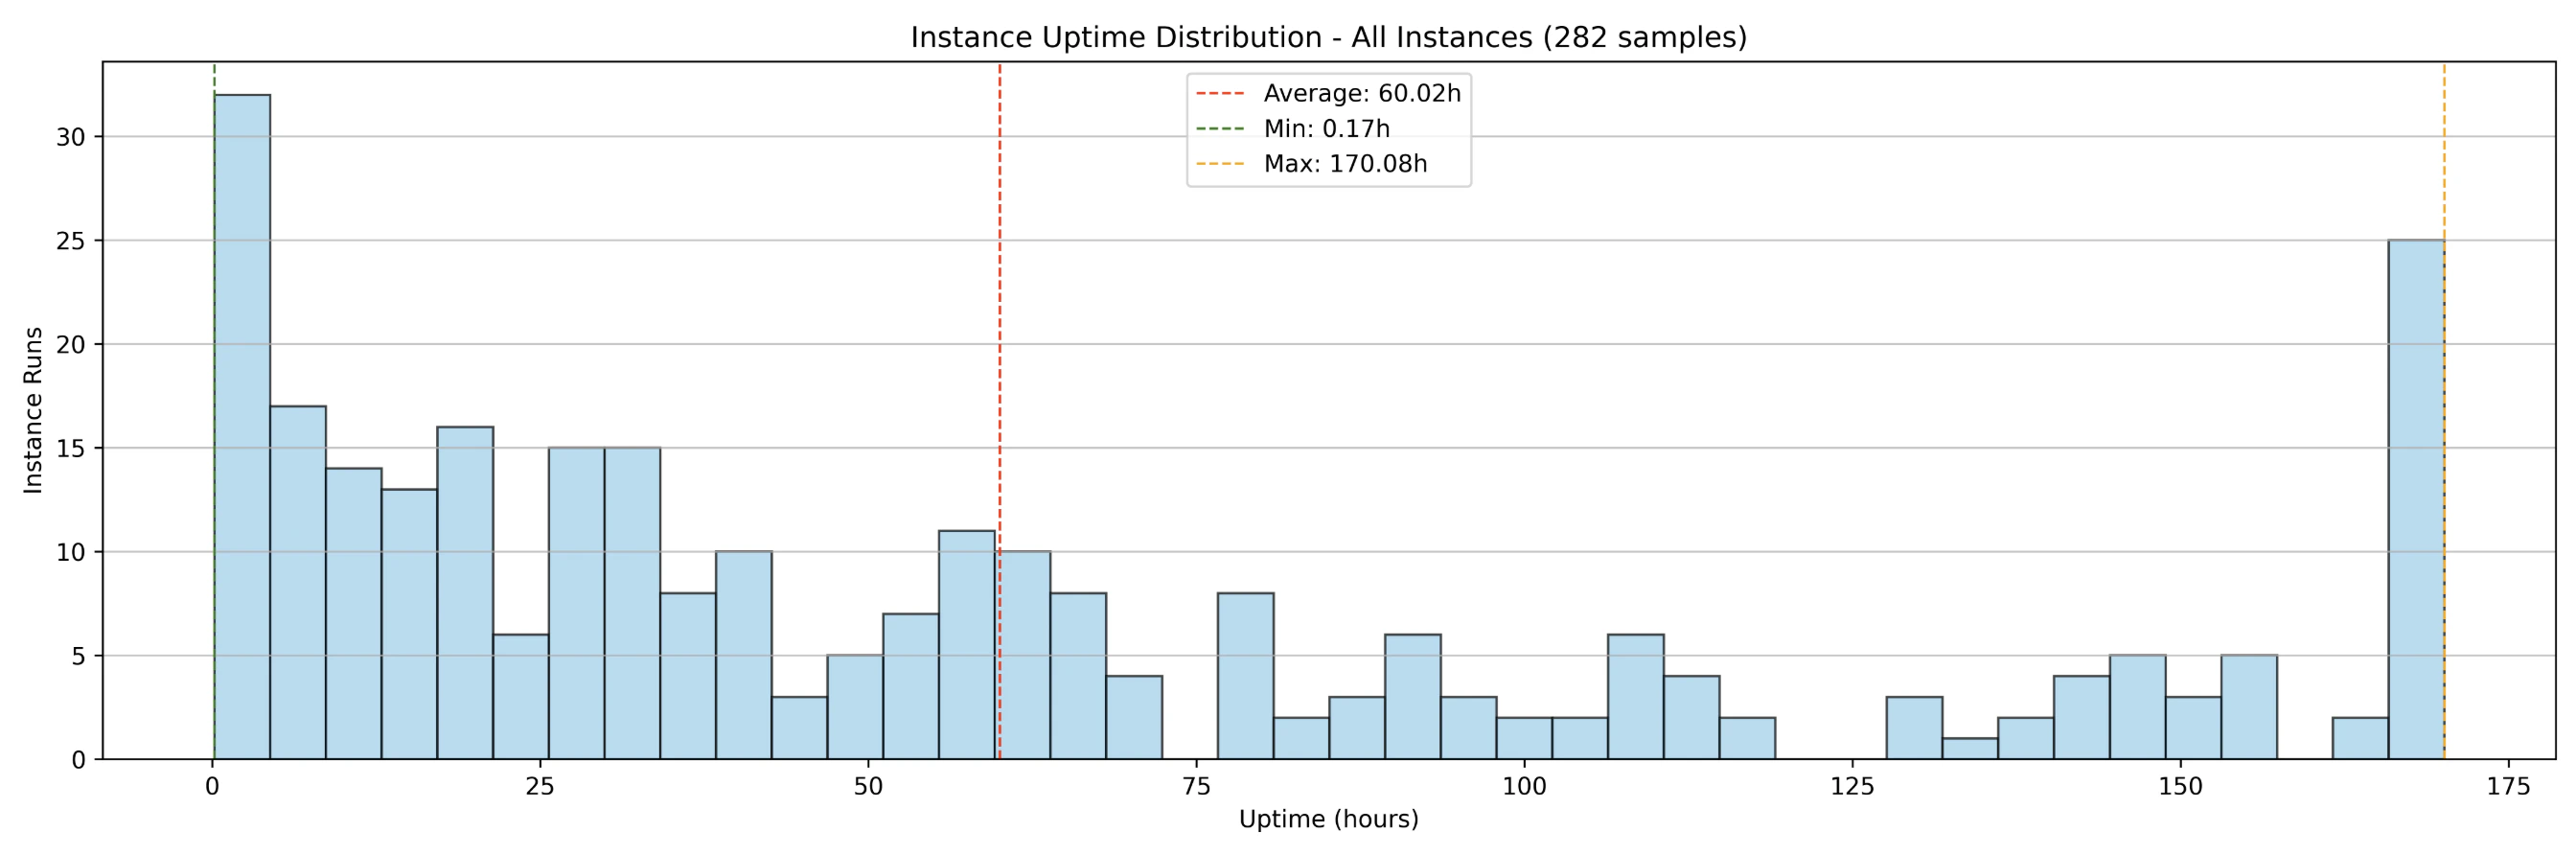
- 100 instances running over 7 days generated
282 samples(instance runs). - Before the container group was shut down,
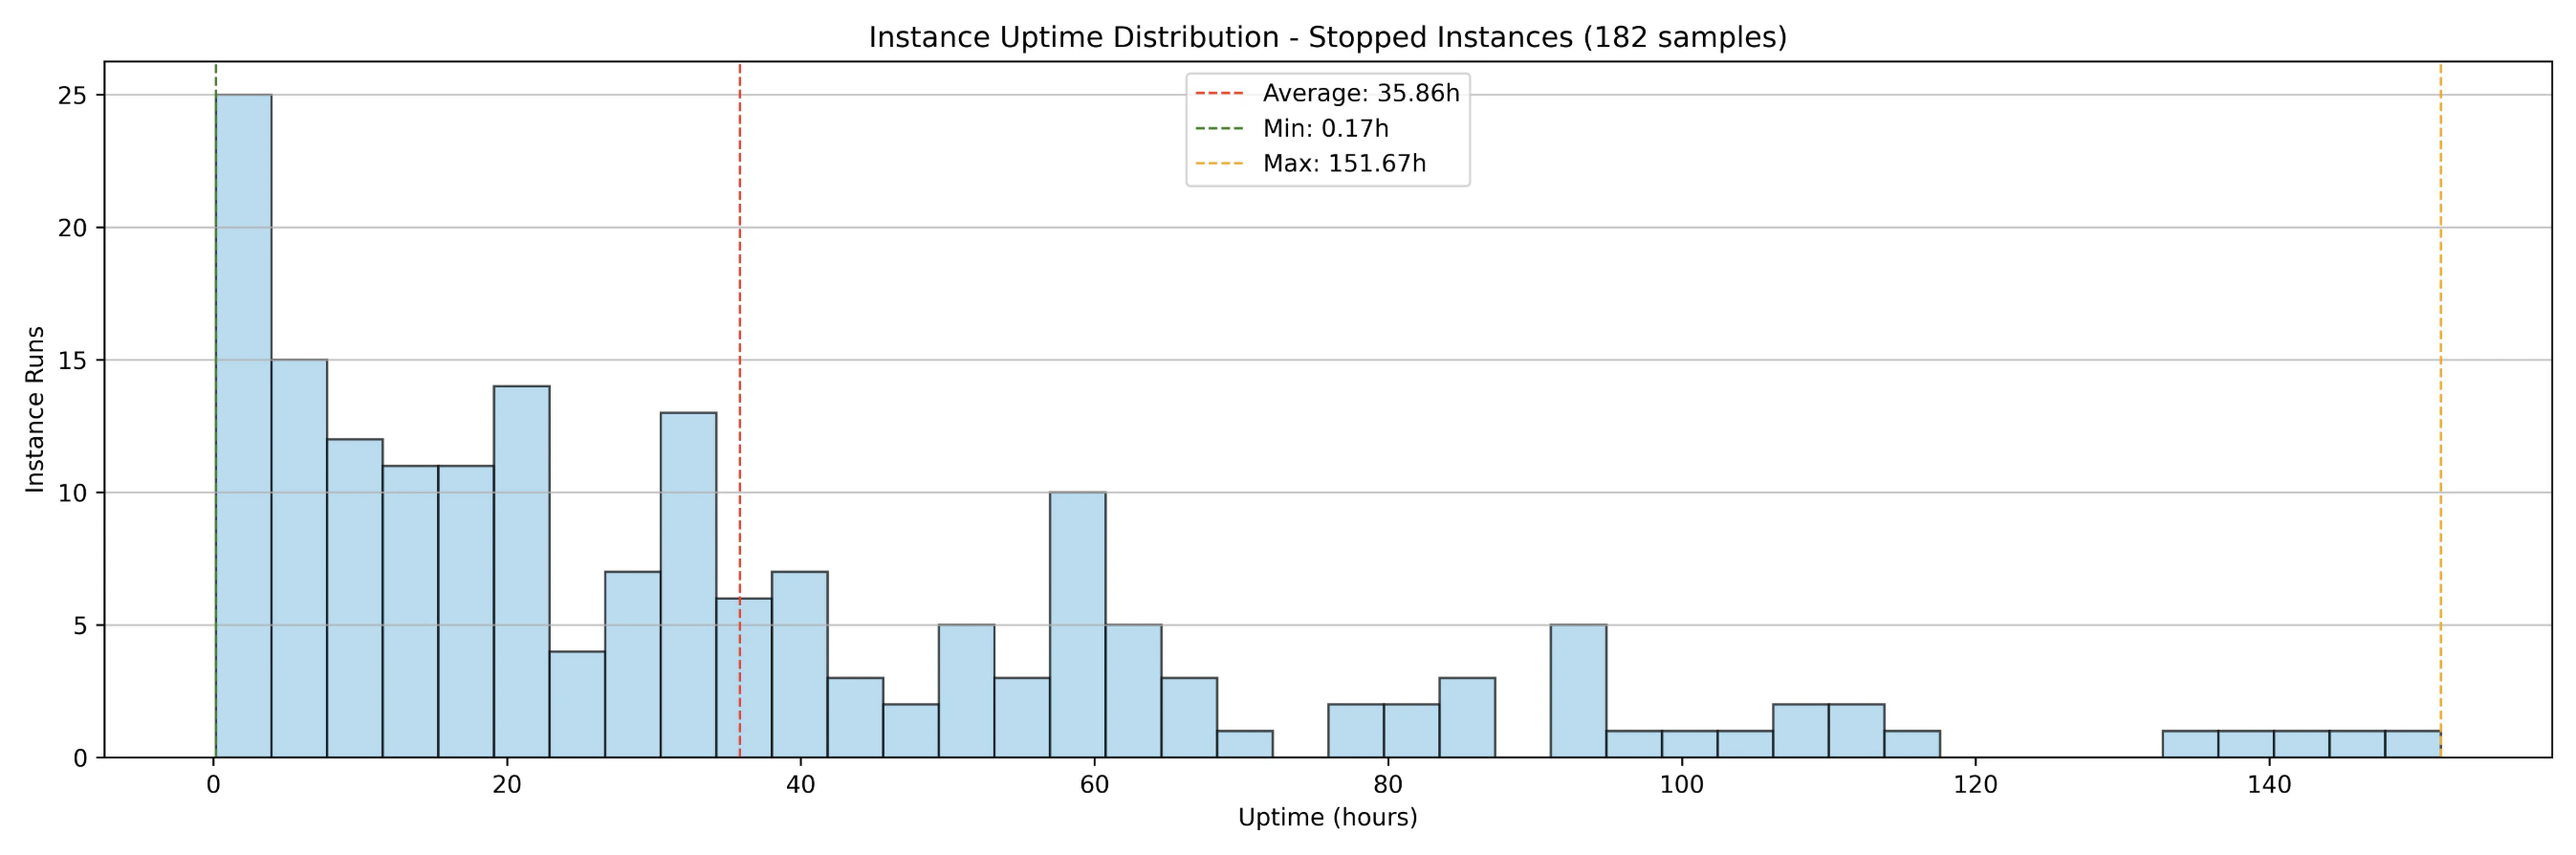
182instance runs had already completed (interrupted) while100instances were still running. 25instances ran uninterrupted for full 7-day period.- The average uptime across all instance runs (interrupted and uninterrupted) was
60 hours. - The average uptime of interrupted instance runs was
35 hours.
Run-to-Request Ratio
The instance run-to-request ratio measures the actual compute capacity available compared to what is requested. For example, if 100 instances are requested and 99 are running, the run-to-request ratio is 99%. When a node goes offline and a replacement is allocated, additional time is required to download and decompress the image before the new instance becomes operational. Because of variations in startup times and uptimes, a 100% run-to-request ratio cannot be consistently guaranteed on SaladCloud’s GPU nodes. Large image sizes can increase startup times, which in turn lowers the run-to-request ratio. To mitigate this, it is often necessary to provision additional instances (5~10%) beyond the initial plan, particularly for real-time inference workloads. Results from the 2025 test show the instance run-to-request ratio over the 7-day period: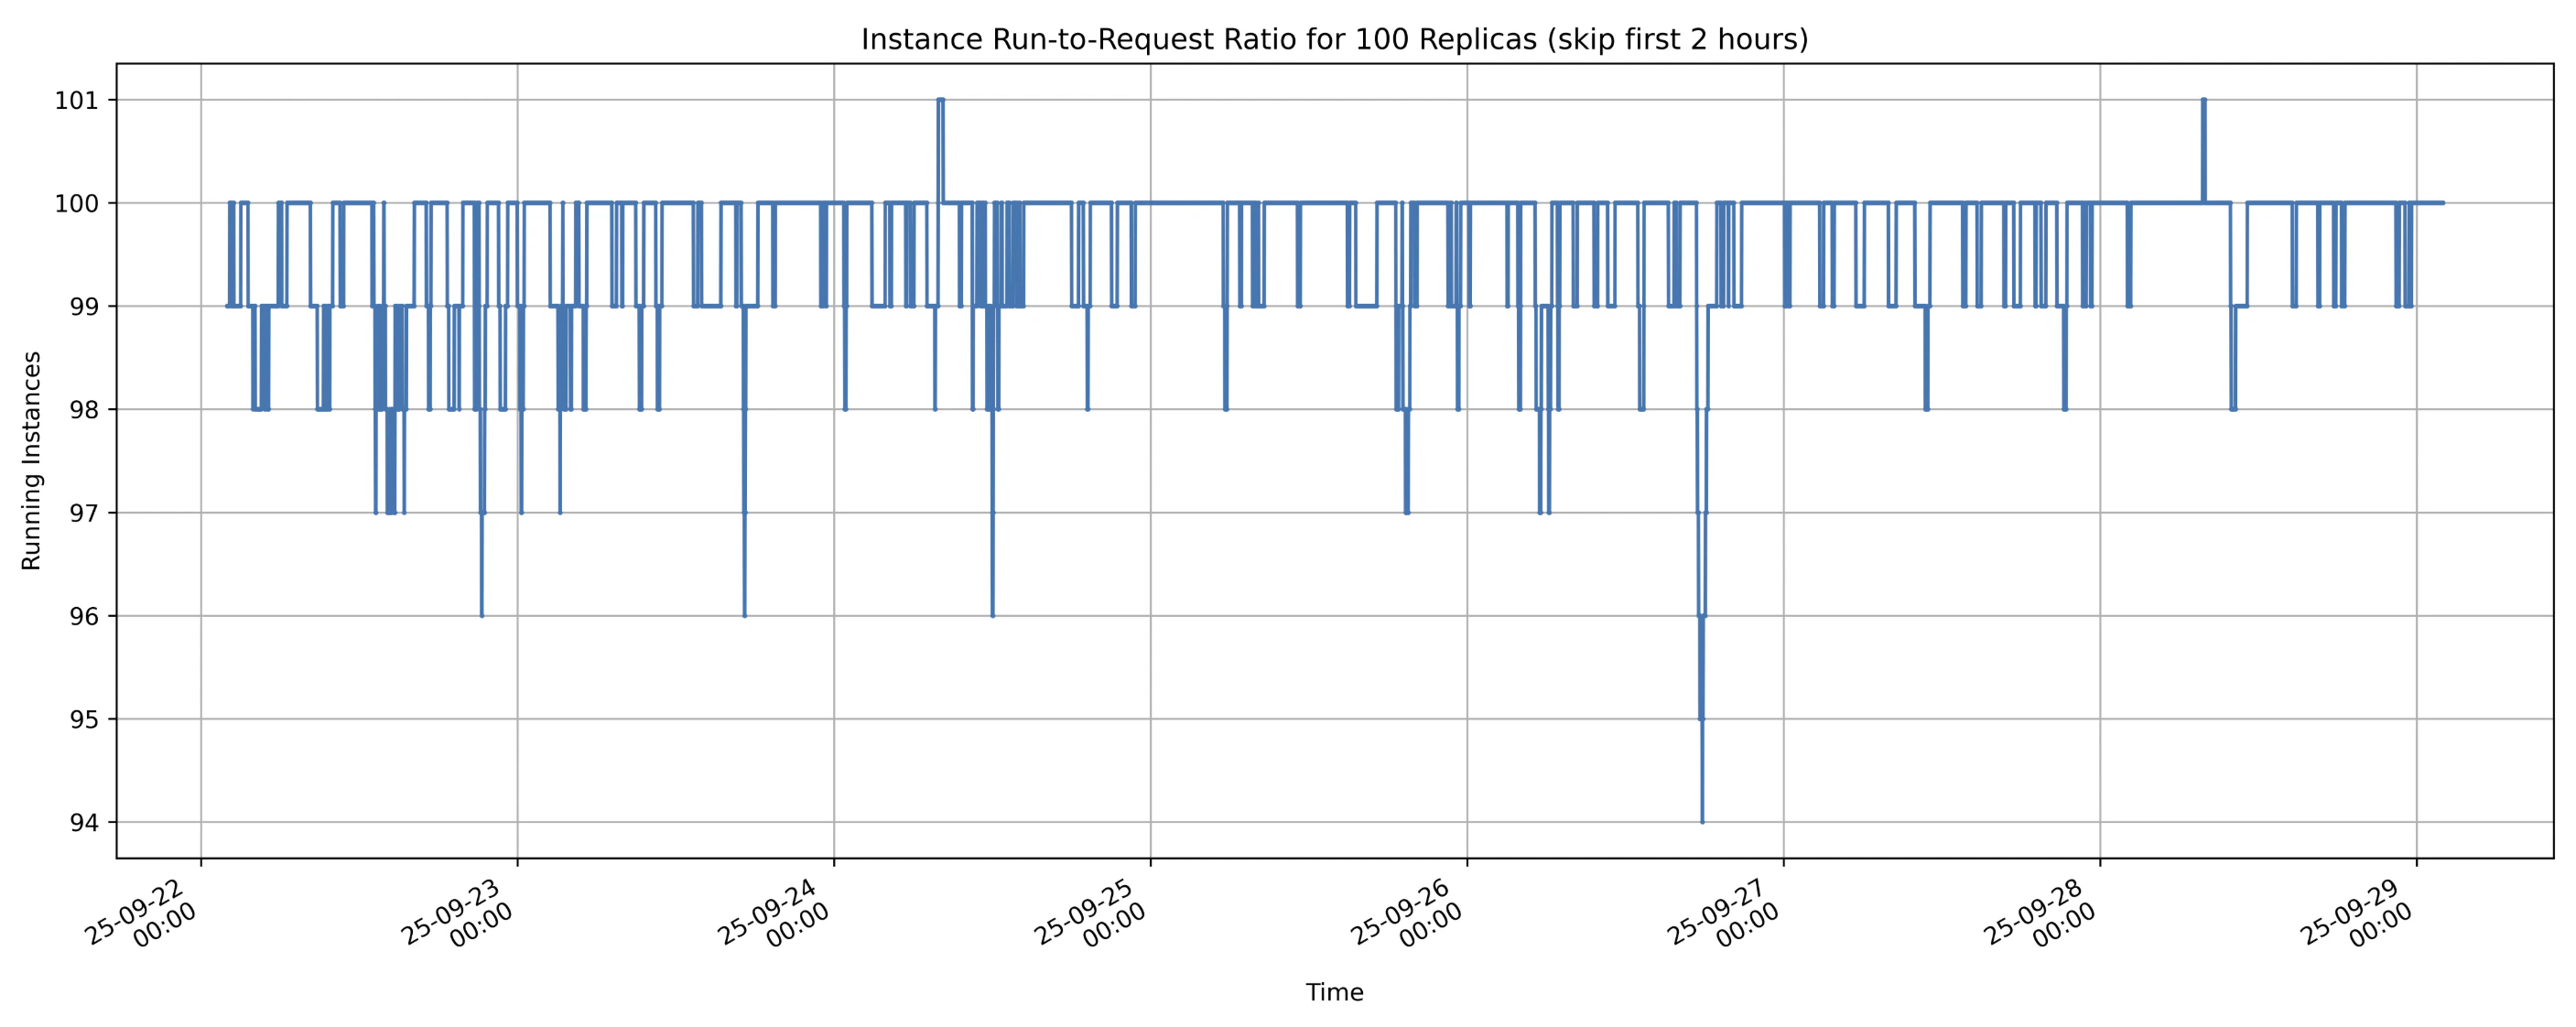
- Lowest instance run-to-request ratio:
94% - Average instance run-to-request ratio:
more than 99% - The instance run-to-request ratio can
temporarily exceed 100%from the application’s perspective. When nodes lose connection to SaladCloud (not charged in this case), applications may continue running briefly before the nodes are fully shut down. During this overlap, as new nodes are allocated and start running, the number of active instances can temporarily exceed the original request.
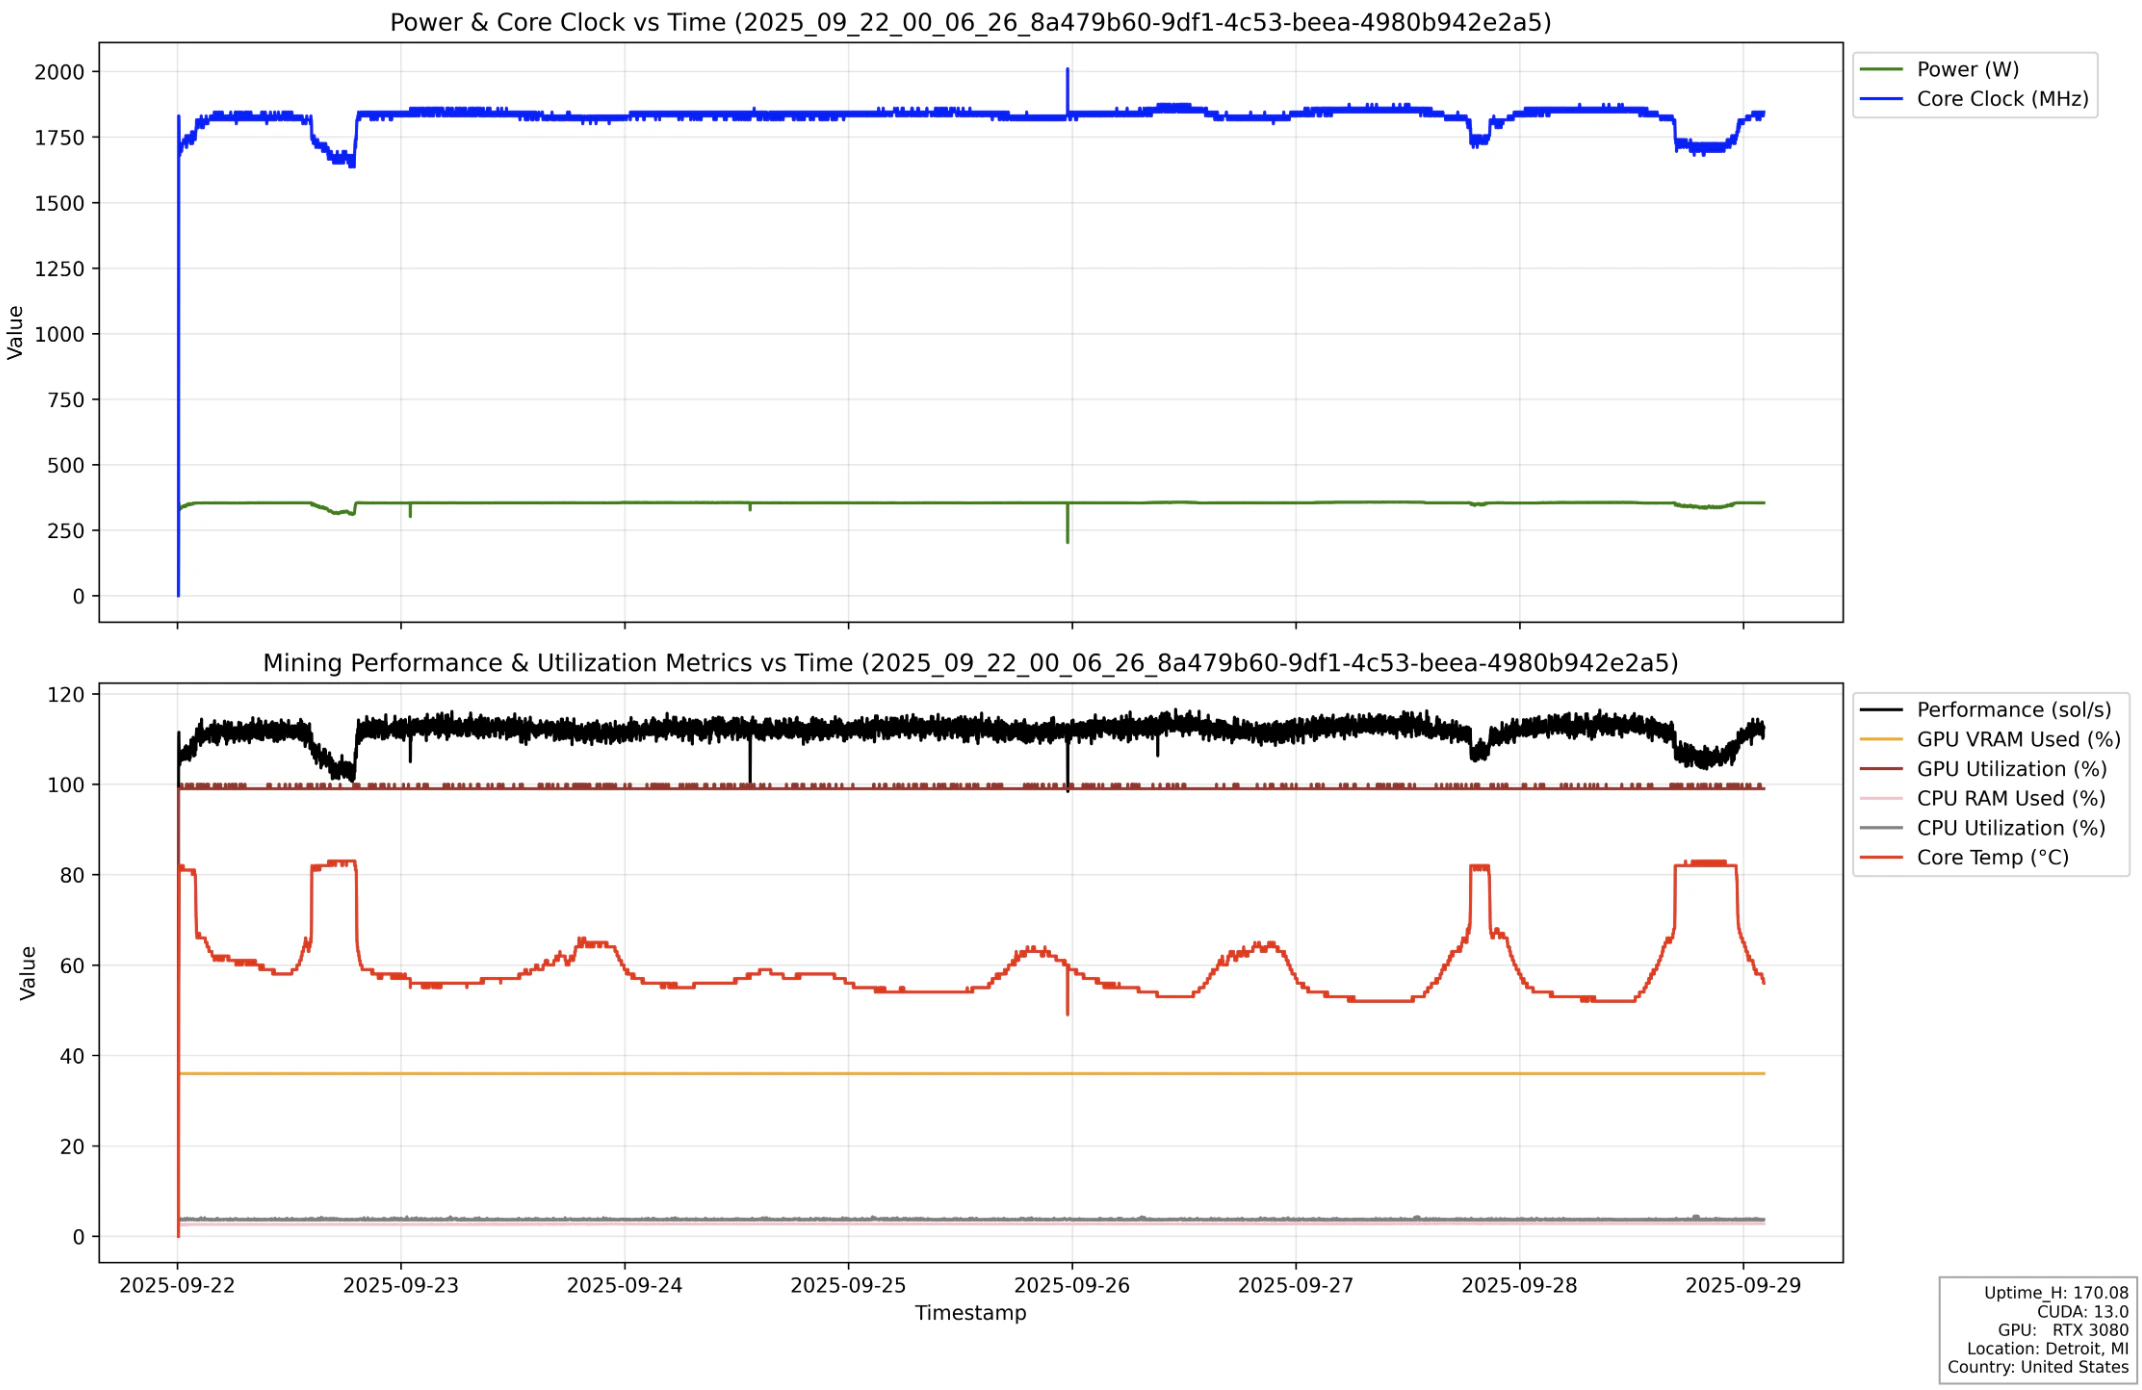
Processing Performance
Nodes with the same consumer GPU type can exhibit different performance due to factors such as system configuration (CPU, RAM), clock speed, cooling, and power limits. Even for the same node, performance may fluctuate over time because of temperature changes and cooling efficiency. Based on our tests, over 90% of SaladCloud’s consumer GPU nodes provide stable and consistent performance. Here is an instance run from the 2025 test, illustrating stable performance (black line) and resource usage over the 7-day execution period.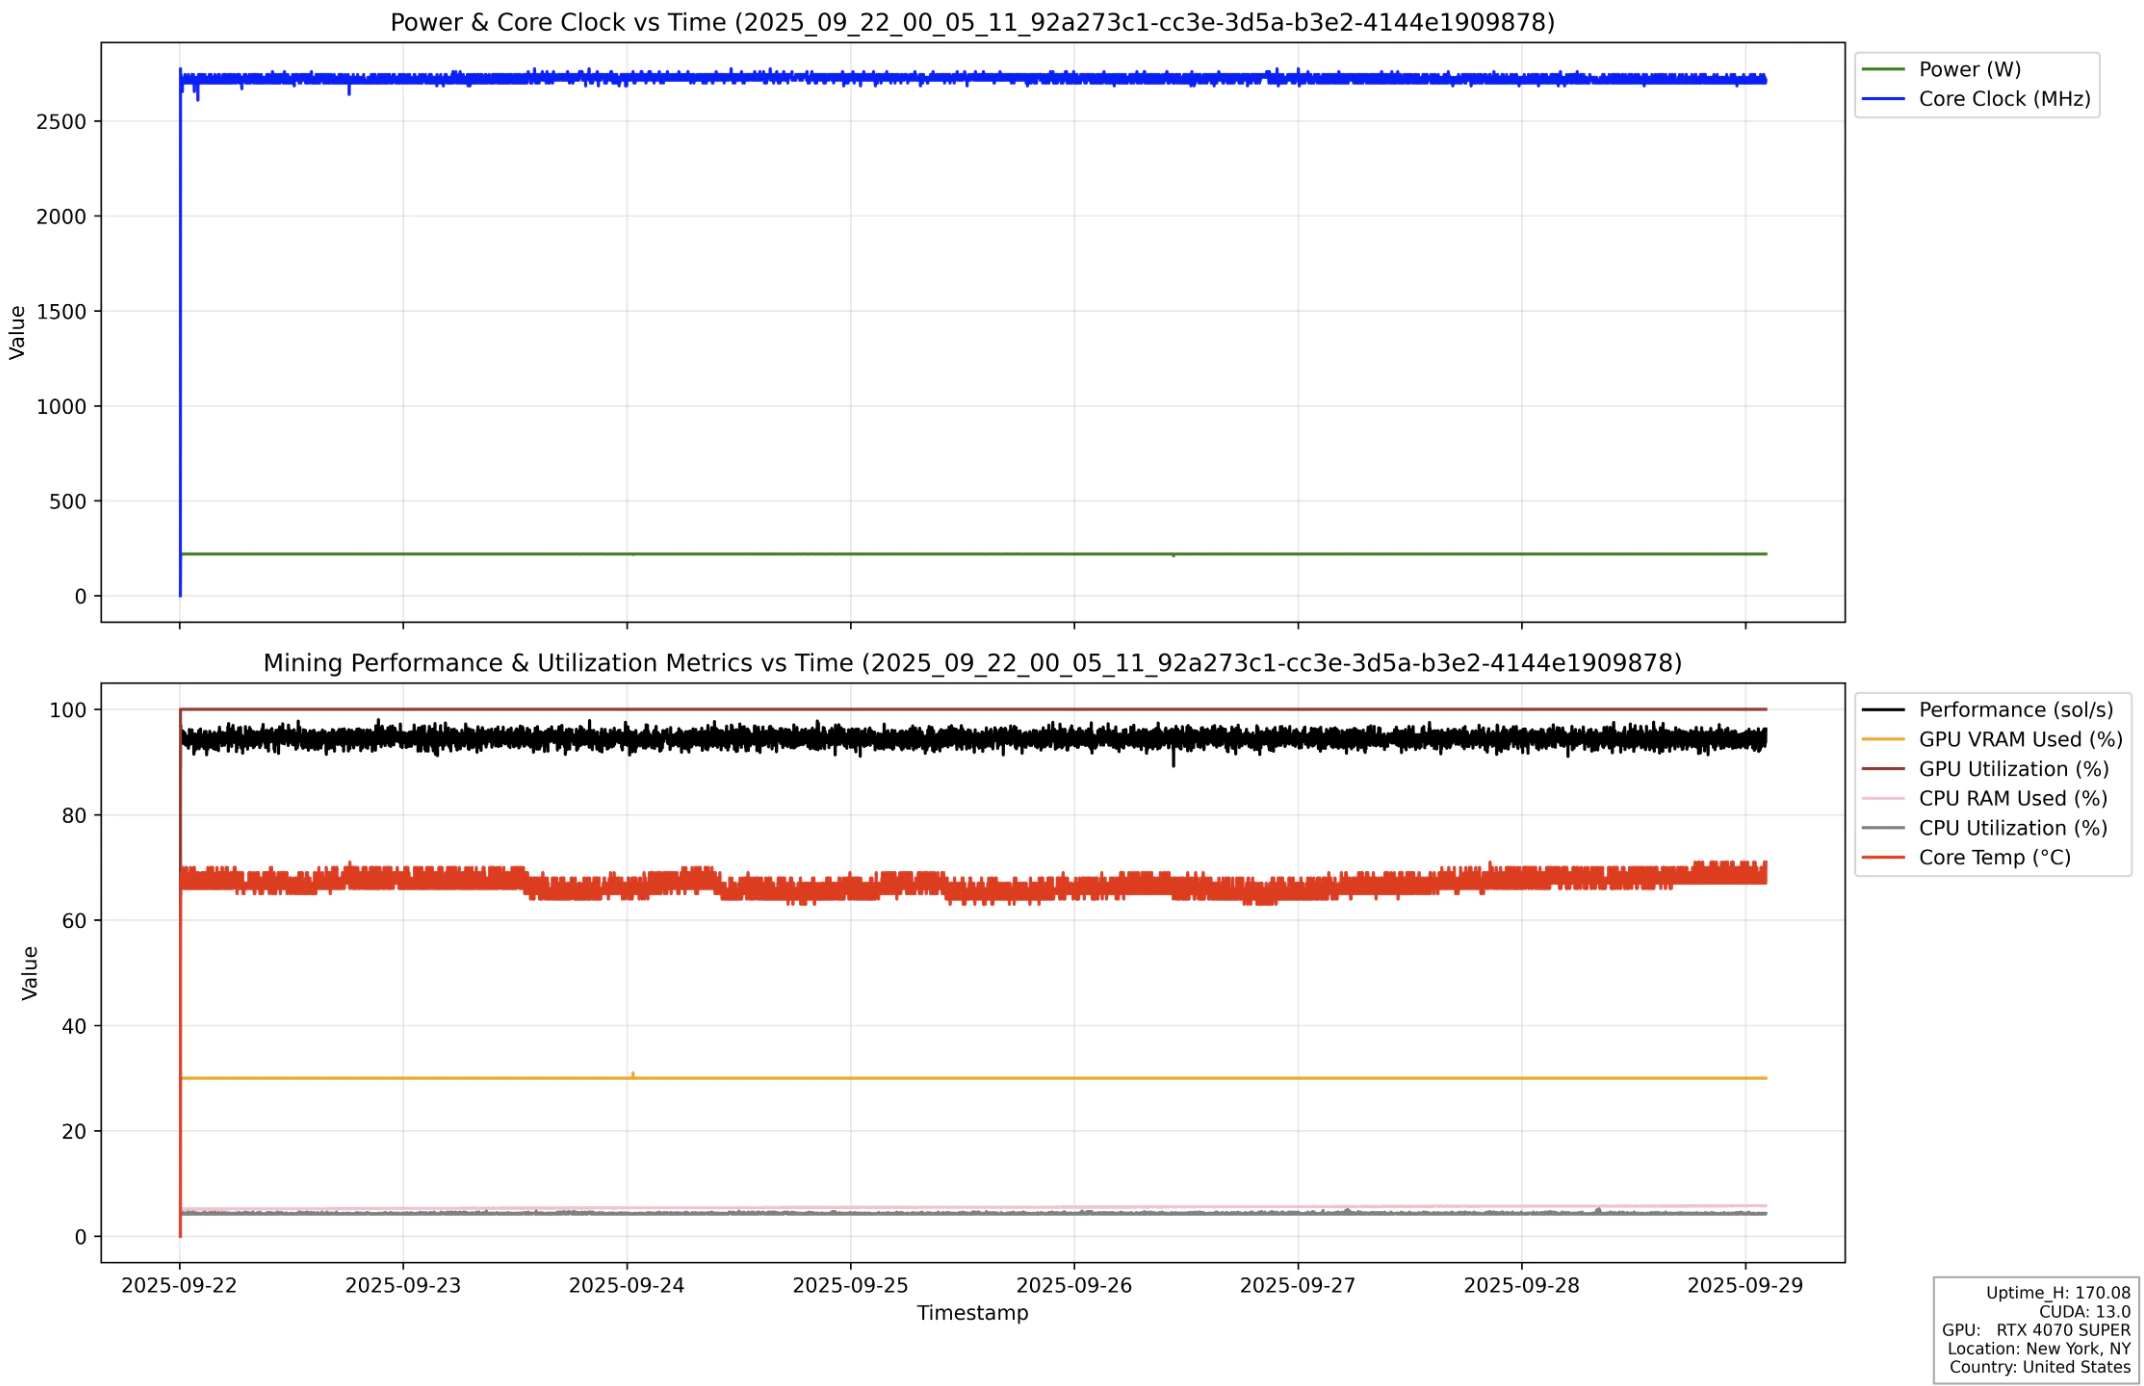
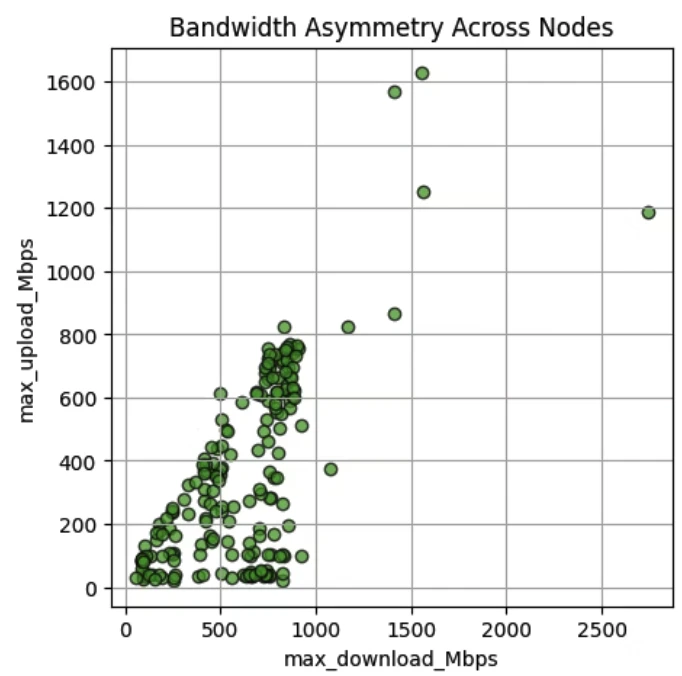
Network Performance
Salad nodes with consumer GPUs often exhibit asymmetric bandwidth, as many operate on residential networks with high download speeds—frequently hundreds of Mbps—but lower upload speeds, sometimes only tens of Mbps. The 2025 test results, based on over 200 consumer GPU nodes performing upload and download tasks, reveal significant speed variance and bandwidth asymmetry. Nevertheless, a substantial number of nodes still provide symmetric bandwidth and strong overall performance.